

























The shot count is often the first number we check after the final score. It is a useful place to start, but it answers a narrow question: how often did a side try to score? To build a fuller picture, separate the number of attempts from where they went and the quality of the opportunities behind them.
Those are different questions. A busy attack is not automatically an effective one, and a quieter side can still produce the moment that decides the match. Here is a practical way to read the figures without asking any single statistic to explain everything.
What is a shot on target?
In Opta's published definitions, shots on target include goals, efforts saved by the goalkeeper and attempts stopped by a last-line defender that would otherwise have gone in. An ordinary defensive block is recorded separately. An effort that strikes the woodwork and stays out is classified as off target.
These are Opta's definitions, rather than a claim that every provider labels every incident identically. If two services disagree, check their definitions and the incident before deciding that either total is wrong. Do not assume that adding off-target attempts to shots on target recreates a total that also includes blocks.
Why the number of attempts is only a starting point
Imagine watching the same passage of play twice. On the first viewing, you count each attempt. On the second, you watch where the attacker receives the ball, the angle and the defenders in the way. The first exercise gives you volume. The second helps you describe what the attack actually created.
A match report should preserve that distinction. Say that a side took more shots when that is what the figures show. Calling those chances better requires more evidence than the count alone.
Where expected goals adds context
Expected goals, usually written as xG, estimates the scoring value of a chance or collection of chances. Hudl Statsbomb's explanation distinguishes chance quality from how a shot is executed and explains why estimates can differ between providers. Details such as the positions of the goalkeeper and defenders can change the assessment.
Read xG as additional context for the opportunities, rather than a replacement scoreline. When comparing figures, keep the provider and definition consistent. If a match page has no xG figure, leave that part of the comparison open rather than inventing one.
A useful order for reading a match
Start with the result and the sequence of events. Then look at attempts, shots on target and any available chance-quality figures together. Ask what each measure contributes to the story, and what remains unanswered.
You can explore the numbers through TotalOdds' Premier League statistics, La Liga statistics and Bundesliga statistics. For a particular game, follow its match page from the relevant fixtures and results list. The aim is a better account of what happened, with the evidence in view.
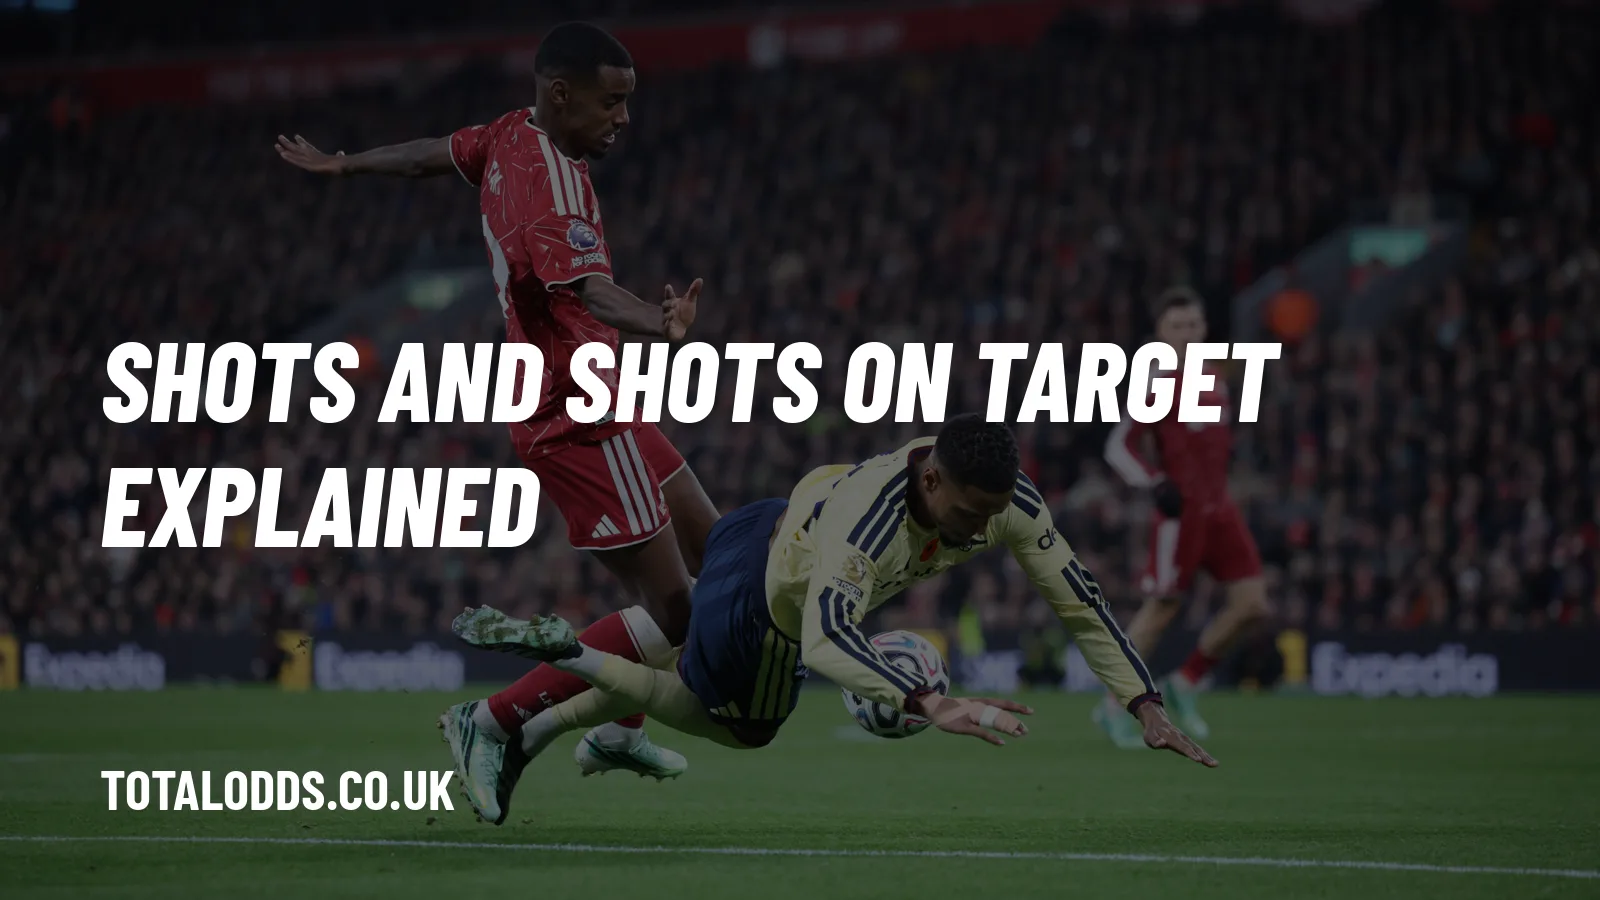
Cover: illustrative file photograph of Liverpool and Arsenal players. Photo: EPL Index, from the existing TotalOdds photo library. It is not presented as a particular shot or scoring moment.