





























 York City
7th in the league on 20 points from 14 games played. Squad, fixtures, expected XI and performance record.
Form
Last 6 results, most recent last.
DDDWLLNext fixtures
 Rochdale
4
Analysis
Sat 21 Nov, 15:00 UTC · MW16
HOME
 Walsall
5
Analysis
Sat 28 Nov, 15:00 UTC · MW17
AWAY
 Colchester United
1
Analysis
Tue 01 Dec, 19:45 UTC · MW18
HOME
 Shrewsbury Town
2
Analysis
Sat 12 Dec, 12:30 UTC · MW19
AWAY
 Tranmere Rovers
5
Analysis
Win/draw/lose are the estimated probabilities for York City, not for the home side. Open a fixture for the full breakdown and the market’s prices.
Previous fixtures
Full match history on file for York City, most recent first. Select a row for the full match page.
| Date | Opponent | Score | Result | Competition | Shots | Match page | |
|---|---|---|---|---|---|---|---|
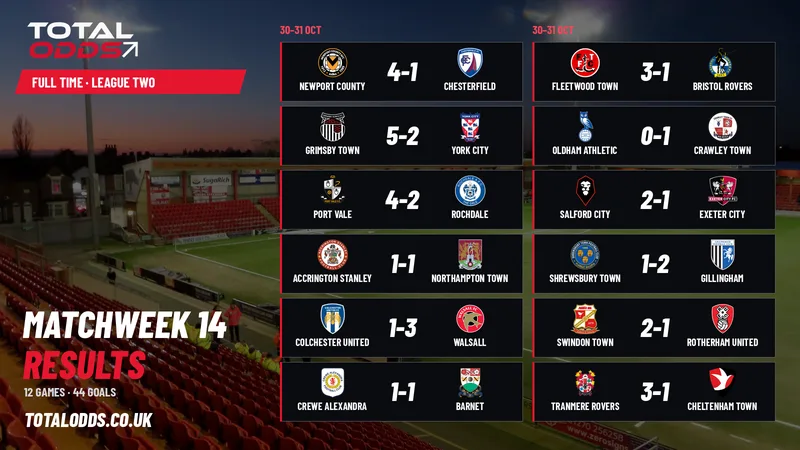
| 31 Oct 26 | Away |  Grimsby Town |
2–5 | L | League Two | 10 (3 on target) | |
| 27 Oct 26 | Away |  Barnet |
1–3 | L | League Two | 8 (2 on target) | |
| 24 Oct 26 | Home |  Port Vale |
2–0 | W | League Two | 13 (4 on target) | |
| 20 Oct 26 | Home |  Accrington Stanley |
1–1 | D | League Two | 16 (6 on target) | |
| 17 Oct 26 | Away |  Newport County |
1–1 | D | League Two | 11 (1 on target) | |
| 10 Oct 26 | Home |  Northampton Town |
1–1 | D | League Two | 13 (2 on target) | |
| 26 Sep 26 | Home |  Gillingham |
3–0 | W | League Two | 17 (6 on target) | |
| 19 Sep 26 | Away |  Chesterfield |
0–2 | L | League Two | 7 (0 on target) | |
| 12 Sep 26 | Home |  Swindon Town |
4–0 | W | League Two | 20 (9 on target) | |
| 05 Sep 26 | Away |  Crewe Alexandra |
1–1 | D | League Two | 27 (6 on target) | |
| 01 Sep 26 | Away |  Cheltenham Town |
2–3 | L | League Two | 20 (5 on target) | |
| 29 Aug 26 | Home |  Exeter City |
2–1 | W | League Two | 11 (8 on target) | |
| 22 Aug 26 | Away |  Rotherham United |
1–1 | D | League Two | 17 (5 on target) | |
| 15 Aug 26 | Home |  Bristol Rovers |
3–2 | W | League Two | 16 (5 on target) | |
| 25 Apr 26 | Away | Rochdale |
1–1 | D | National League | - | |
| 18 Apr 26 | Home |  Yeovil Town |
3–0 | W | National League | - | |
| 11 Apr 26 | Away |  Tamworth |
1–0 | W | National League | - | |
| 06 Apr 26 | Home |  Altrincham |
2–1 | W | National League | - | |
| 03 Apr 26 | Away |  Boston United |
1–0 | W | National League | - | |
| 28 Mar 26 | Home |  Woking |
1–0 | W | National League | - | |
| 24 Mar 26 | Away |  Gateshead |
1–3 | L | National League | - | |
| 21 Mar 26 | Home |  Brackley Town |
4–0 | W | National League | - | |
| 14 Mar 26 | Away |  Aldershot Town |
3–0 | W | National League | - | |
| 07 Mar 26 | Home |  Eastleigh |
3–1 | W | National League | - | |
| 03 Mar 26 | Away |  Boreham Wood |
2–3 | L | National League | - | |
| 28 Feb 26 | Away |  Morecambe |
1–0 | W | National League | - | |
| 24 Feb 26 | Away |  Scunthorpe United |
3–0 | W | National League | - | |
| 21 Feb 26 | Home |  Halifax Town |
4–1 | W | National League | - | |
| 14 Feb 26 | Away |  Wealdstone |
3–0 | W | National League | - | |
| 11 Feb 26 | Home |  Hartlepool United |
3–2 | W | National League | - | |
| 07 Feb 26 | Home |  Forest Green Rovers |
2–1 | W | National League | - | |
| 31 Jan 26 | Away |  Solihull Moors |
2–0 | W | National League | - | |
| 24 Jan 26 | Home |  Braintree Town |
5–0 | W | National League | - | |
| 21 Jan 26 | Away |  Carlisle United |
3–0 | W | National League | - | |
| 17 Jan 26 | Home |  Southend United |
1–1 | D | National League | - | |
| 10 Jan 26 | Away |  Sutton United |
2–1 | W | National League | - | |
| 30 Dec 25 | Away | Altrincham |
2–1 | W | National League | - | |
| 26 Dec 25 | Home | Boston United |
2–2 | D | National League | - | |
| 20 Dec 25 | Home |  Truro City |
4–0 | W | National League | - | |
| 29 Nov 25 | Home | Aldershot Town |
5–1 | W | National League | - | |
| 22 Nov 25 | Away | Brackley Town |
3–2 | W | National League | - | |
| 15 Nov 25 | Home | Morecambe |
4–2 | W | National League | - | |
| 11 Nov 25 | Home | Rochdale |
4–1 | W | National League | - | |
| 08 Nov 25 | Away | Eastleigh |
4–2 | W | National League | - | |
| 05 Nov 25 | Home | Gateshead |
4–0 | W | National League | - | |
| 25 Oct 25 | Away | Halifax Town |
1–1 | D | National League | - | |
| 21 Oct 25 | Home | Boreham Wood |
2–2 | D | National League | - | |
| 18 Oct 25 | Home | Wealdstone |
4–0 | W | National League | - | |
| 04 Oct 25 | Away | Hartlepool United |
2–1 | W | National League | - | |
| 01 Oct 25 | Home | Scunthorpe United |
1–3 | L | National League | - | |
| 27 Sep 25 | Away | Forest Green Rovers |
1–1 | D | National League | - | |
| 23 Sep 25 | Home | Carlisle United |
5–0 | W | National League | - | |
| 20 Sep 25 | Home | Solihull Moors |
0–1 | L | National League | - | |
| 13 Sep 25 | Away | Braintree Town |
3–2 | W | National League | - | |
| 09 Sep 25 | Home | Tamworth |
4–0 | W | National League | - | |
| 06 Sep 25 | Away | Yeovil Town |
3–1 | W | National League | - | |
| 25 Aug 25 | Away | Woking |
1–1 | D | National League | - | |
| 20 Aug 25 | Away | Southend United |
0–0 | D | National League | - | |
| 16 Aug 25 | Away | Truro City |
2–0 | W | National League | - | |
| 09 Aug 25 | Home | Sutton United |
2–2 | D | National League | - | |
| 05 May 25 | Away | Eastleigh |
2–0 | W | National League | - | |
| 26 Apr 25 | Home | Solihull Moors |
2–0 | W | National League | - | |
| 21 Apr 25 | Home |  Oldham Athletic |
1–1 | D | National League | - | |
| 18 Apr 25 | Away | Gateshead |
3–1 | W | National League | - | |
| 12 Apr 25 | Home | Aldershot Town |
7–2 | W | National League | - | |
| 05 Apr 25 | Away |  AFC Fylde |
3–1 | W | National League | - | |
| 29 Mar 25 | Home | Wealdstone |
3–0 | W | National League | - | |
| 25 Mar 25 | Away | Rochdale |
4–0 | W | National League | - | |
| 22 Mar 25 | Away | Braintree Town |
1–2 | L | National League | - | |
| 15 Mar 25 | Away | Yeovil Town |
1–0 | W | National League | - | |
| 08 Mar 25 | Home | Forest Green Rovers |
1–1 | D | National League | - | |
| 04 Mar 25 | Home | Altrincham |
1–2 | L | National League | - | |
| 01 Mar 25 | Away | Hartlepool United |
1–0 | W | National League | - | |
| 25 Feb 25 | Away | Maidenhead United | 3–1 | W | National League | - | |
| 22 Feb 25 | Home | Halifax Town |
2–2 | D | National League | - | |
| 18 Feb 25 | Away | Barnet |
1–3 | L | National League | - | |
| 15 Feb 25 | Away | Ebbsfleet United | 2–0 | W | National League | - | |
| 08 Feb 25 | Home | Woking |
3–0 | W | National League | - | |
| 01 Feb 25 | Home | Dagenham & Redbridge | 2–1 | W | National League | - | |
| 25 Jan 25 | Away | Boston United |
1–3 | L | National League | - | |
| 21 Jan 25 | Away | Oldham Athletic |
2–0 | W | National League | - | |
| 18 Jan 25 | Home | Sutton United |
1–2 | L | National League | - | |
| 01 Jan 25 | Home | Gateshead |
1–0 | W | National League | - | |
| 21 Dec 24 | Home | Southend United |
3–0 | W | National League | - | |
| 14 Dec 24 | Away | Tamworth |
1–1 | D | National League | - | |
| 30 Nov 24 | Home | Maidenhead United | 6–2 | W | National League | - | |
| 26 Nov 24 | Away | Altrincham |
0–3 | L | National League | - | |
| 23 Nov 24 | Home | Yeovil Town |
4–0 | W | National League | - | |
| 16 Nov 24 | Away | Forest Green Rovers |
0–2 | L | National League | - | |
| 09 Nov 24 | Home | Hartlepool United |
5–3 | W | National League | - | |
| 26 Oct 24 | Away | Halifax Town |
2–1 | W | National League | - | |
| 22 Oct 24 | Home | Barnet |
3–1 | W | National League | - | |
| 19 Oct 24 | Home | Ebbsfleet United | 4–0 | W | National League | - | |
| 05 Oct 24 | Away | Woking |
1–1 | D | National League | - | |
| 28 Sep 24 | Home | Eastleigh |
0–0 | D | National League | - | |
| 24 Sep 24 | Away | Solihull Moors |
3–0 | W | National League | - | |
| 21 Sep 24 | Away | Aldershot Town |
0–0 | D | National League | - | |
| 14 Sep 24 | Home | AFC Fylde |
3–0 | W | National League | - | |
| 10 Sep 24 | Home | Braintree Town |
2–1 | W | National League | - | |
| 07 Sep 24 | Away | Wealdstone |
2–0 | W | National League | - | |
| 31 Aug 24 | Away | Dagenham & Redbridge | 2–0 | W | National League | - | |
| 26 Aug 24 | Home | Boston United |
0–2 | L | National League | - | |
| 24 Aug 24 | Away | Sutton United |
2–2 | D | National League | - | |
| 20 Aug 24 | Home | Rochdale |
1–0 | W | National League | - | |
| 17 Aug 24 | Home | Tamworth |
2–0 | W | National League | - | |
| 10 Aug 24 | Away | Southend United |
1–1 | D | National League | - | |
| 20 Apr 24 | Away | Solihull Moors |
0–1 | L | National League | - | |
| 13 Apr 24 | Home | Woking |
2–0 | W | National League | - | |
| 06 Apr 24 | Home | Eastleigh |
0–1 | L | National League | - | |
| 02 Apr 24 | Away | Halifax Town |
1–1 | D | National League | - | |
| 29 Mar 24 | Home | Chesterfield |
2–1 | W | National League | - | |
| 23 Mar 24 | Away |  Bromley |
2–0 | W | National League | - | |
| 16 Mar 24 | Home | Aldershot Town |
1–0 | W | National League | - | |
| 12 Mar 24 | Away | Altrincham |
1–6 | L | National League | - | |
| 09 Mar 24 | Away |  Kidderminster Harriers |
0–0 | D | National League | - | |
| 05 Mar 24 | Home | AFC Fylde |
1–3 | L | National League | - | |
| 02 Mar 24 | Home | Wealdstone |
2–3 | L | National League | - | |
| 24 Feb 24 | Away | Barnet |
0–2 | L | National League | - | |
| 20 Feb 24 | Home | Oldham Athletic |
1–1 | D | National League | - | |
| 17 Feb 24 | Home | Dagenham & Redbridge | 1–1 | D | National League | - | |
| 13 Feb 24 | Home | Dorking Wanderers | 0–1 | L | National League | - | |
| 10 Feb 24 | Away | Southend United |
1–0 | W | National League | - | |
| 03 Feb 24 | Home | Maidenhead United | 1–1 | D | National League | - | |
| 27 Jan 24 | Away | Hartlepool United |
1–2 | L | National League | - | |
| 23 Jan 24 | Away | Oxford City | 2–1 | W | National League | - | |
| 07 Jan 24 | Away | Boreham Wood |
1–1 | D | National League | - | |
| 01 Jan 24 | Home | Gateshead |
2–0 | W | National League | - | |
| 26 Dec 23 | Away | Gateshead |
1–1 | D | National League | - | |
| 23 Dec 23 | Home | Ebbsfleet United | 1–1 | D | National League | - | |
| 16 Dec 23 | Away | Rochdale |
0–0 | D | National League | - | |
| 25 Nov 23 | Away | Maidenhead United | 1–1 | D | National League | - | |
| 21 Nov 23 | Home | Oxford City | 2–0 | W | National League | - | |
| 18 Nov 23 | Home | Hartlepool United |
1–3 | L | National League | - | |
| 11 Nov 23 | Away | AFC Fylde |
2–0 | W | National League | - | |
| 28 Oct 23 | Home | Halifax Town |
1–1 | D | National League | - | |
| 24 Oct 23 | Away | Chesterfield |
0–4 | L | National League | - | |
| 21 Oct 23 | Away | Eastleigh |
1–3 | L | National League | - | |
| 07 Oct 23 | Home | Bromley |
2–2 | D | National League | - | |
| 03 Oct 23 | Away | Dagenham & Redbridge | 2–1 | W | National League | - | |
| 30 Sep 23 | Home | Solihull Moors |
2–2 | D | National League | - | |
| 26 Sep 23 | Home | Barnet |
2–4 | L | National League | - | |
| 23 Sep 23 | Away | Woking |
2–1 | W | National League | - | |
| 19 Sep 23 | Away | Oldham Athletic |
0–2 | L | National League | - | |
| 16 Sep 23 | Home | Southend United |
3–0 | W | National League | - | |
| 09 Sep 23 | Home | Boreham Wood |
2–2 | D | National League | - | |
| 02 Sep 23 | Away | Ebbsfleet United | 1–4 | L | National League | - | |
| 28 Aug 23 | Home | Rochdale |
1–3 | L | National League | - | |
| 26 Aug 23 | Away | Dorking Wanderers | 2–2 | D | National League | - | |
| 19 Aug 23 | Away | Aldershot Town |
1–1 | D | National League | - | |
| 15 Aug 23 | Home | Altrincham |
2–2 | D | National League | - | |
| 12 Aug 23 | Home | Kidderminster Harriers |
0–1 | L | National League | - | |
| 05 Aug 23 | Away | Wealdstone |
1–2 | L | National League | - | |
| 29 Apr 23 | Away |  Notts County |
1–1 | D | National League | - | |
| 22 Apr 23 | Home | Aldershot Town |
2–2 | D | National League | - | |
| 15 Apr 23 | Away | Torquay United | 2–3 | L | National League | - | |
| 10 Apr 23 | Home | Halifax Town |
0–3 | L | National League | - | |
| 07 Apr 23 | Away | Chesterfield |
3–1 | W | National League | - | |
| 03 Apr 23 | Home | Barnet |
1–0 | W | National League | - | |
| 28 Mar 23 | Home | Scunthorpe United |
0–0 | D | National League | - | |
| 25 Mar 23 | Away |  Wrexham |
0–3 | L | National League | - | |
| 18 Mar 23 | Home | Dorking Wanderers | 2–1 | W | National League | - | |
| 14 Mar 23 | Home | Altrincham |
1–2 | L | National League | - | |
| 07 Mar 23 | Away | Bromley |
3–0 | W | National League | - | |
| 04 Mar 23 | Away | Dagenham & Redbridge | 1–2 | L | National League | - | |
| 28 Feb 23 | Away | Eastleigh |
0–1 | L | National League | - | |
| 25 Feb 23 | Home | Yeovil Town |
2–1 | W | National League | - | |
| 21 Feb 23 | Home | Boreham Wood |
1–1 | D | National League | - | |
| 18 Feb 23 | Away | Wealdstone |
1–3 | L | National League | - | |
| 07 Feb 23 | Home | Solihull Moors |
2–3 | L | National League | - | |
| 04 Feb 23 | Away | Southend United |
0–2 | L | National League | - | |
| 28 Jan 23 | Home | Maidenhead United | 1–2 | L | National League | - | |
| 24 Jan 23 | Away | Oldham Athletic |
0–2 | L | National League | - | |
| 07 Jan 23 | Home | Maidstone United | 4–1 | W | National League | - | |
| 02 Jan 23 | Away | Gateshead |
2–2 | D | National League | - | |
| 26 Dec 22 | Home | Gateshead |
0–3 | L | National League | - | |
| 10 Dec 22 | Away | Woking |
2–0 | W | National League | - | |
| 03 Dec 22 | Home | Wrexham |
1–1 | D | National League | - | |
| 26 Nov 22 | Away | Dorking Wanderers | 0–1 | L | National League | - | |
| 19 Nov 22 | Home | Wealdstone |
1–2 | L | National League | - | |
| 12 Nov 22 | Away | Altrincham |
1–2 | L | National League | - | |
| 08 Nov 22 | Away | Boreham Wood |
1–1 | D | National League | - | |
| 29 Oct 22 | Home | Southend United |
0–2 | L | National League | - | |
| 25 Oct 22 | Home | Chesterfield |
1–1 | D | National League | - | |
| 22 Oct 22 | Away | Aldershot Town |
1–2 | L | National League | - | |
| 11 Oct 22 | Home | Dagenham & Redbridge | 1–1 | D | National League | - | |
| 08 Oct 22 | Home | Torquay United | 1–0 | W | National League | - | |
| 04 Oct 22 | Away | Halifax Town |
0–1 | L | National League | - | |
| 01 Oct 22 | Away | Barnet |
5–0 | W | National League | - | |
| 24 Sep 22 | Home | Notts County |
1–3 | L | National League | - | |
| 17 Sep 22 | Away | Scunthorpe United |
1–1 | D | National League | - | |
| 13 Sep 22 | Home | Bromley |
2–1 | W | National League | - | |
| 03 Sep 22 | Away | Yeovil Town |
1–0 | W | National League | - | |
| 29 Aug 22 | Home | Oldham Athletic |
1–1 | D | National League | - | |
| 27 Aug 22 | Away | Maidenhead United | 1–0 | W | National League | - | |
| 20 Aug 22 | Home | Eastleigh |
0–1 | L | National League | - | |
| 17 Aug 22 | Away | Solihull Moors |
1–1 | D | National League | - | |
| 13 Aug 22 | Away | Maidstone United | 1–2 | L | National League | - | |
| 06 Aug 22 | Home | Woking |
2–0 | W | National League | - |
Scroll the table sideways for every column
Season Statistics
Games Played: 14
PPG ?Points per game this season (win = 3, draw = 1, loss = 0), with the win/draw/loss split behind it.
- Win · 5 (36%)
- Draw · 5 (36%)
- Loss · 4 (29%)
Clean Sheets ?How often this team has kept a clean sheet (conceded zero goals) this season.
- Yes · 3 (21%)
- No · 11 (79%)
BTTS ?Both Teams To Score: how often this team's matches have seen both sides get on the scoresheet this season.
- Yes · 10 (71%)
- No · 4 (29%)
O/U 2.5 Goals ?How often this team's matches have finished with more (Over) or fewer (Under) than 2.5 total goals this season.
- Over · 7 (50%)
- Under · 7 (50%)
O/U 9.5 Corners ?How often this team's matches have finished with more (Over) or fewer (Under) than 9.5 total corners this season.
- Over · 8 (57%)
- Under · 6 (43%)
All-time record
Recent form (Last 6)
7th in the league · 20 pts
| Results | PPG | |
|---|---|---|
| Overall | DDDWLL | 1.00 |
| Home | WWWDDW | 2.33 |
| Away | LDLDLL | 0.33 |
Career Overall
| Overall | Home | Away | |
|---|---|---|---|
| Win % | 46% | 52% | 41% |
| Goals/game (both sides) | 2.92 | 3.15 | 2.70 |
| Scored/game | 1.73 | 2.03 | 1.43 |
| Conceded/game | 1.19 | 1.12 | 1.26 |
| Both teams scored | 58% | 59% | 57% |
| Clean sheets | 31% | 32% | 30% |
| Failed to score | 14% | 11% | 17% |
| xG/game | 1.78 | 1.91 | 1.66 |
| xG against/game | 1.19 | 1.14 | 1.24 |
| npxG/game | 1.65 | 1.75 | 1.55 |
| Led at half-time | 37% | 42% | 31% |
| Comebacks (trailed at HT, won) | 13% | 15% | 12% |
Historic Bets
York City’s 5 most frequent betting markets, based on its entire match history on file.
- 1 To Score 85.9% Based on 198 matches on file · National League average 74.9% +11 pts
- 2 Team Over 3.5 Corners 85.7% Based on 14 matches on file · National League average 67.4% +18 pts
- 3 Over 1.5 Goals in the Match 85.4% Based on 198 matches on file · National League average 77.6% +8 pts
- 4 Over 7.5 Corners in the Match 78.6% Based on 14 matches on file · National League average 74.1% +5 pts
- 5 1st Half Over 0.5 Goals 73.7% Based on 198 matches on file · National League average 72.1% +2 pts
York City betting trends at a glance Above average
Over 198 matches on file, York City's most frequent betting market is To Score, which has landed 85.9% of the time. Team Over 3.5 Corners (85.7%) and Over 1.5 Goals in the Match (85.4%) follow, with Over 7.5 Corners in the Match and 1st Half Over 0.5 Goals completing the top 5.
The standout against the average National League side is To Score: 85.9% for York City against 74.9% league wide, 11 percentage points higher. A few of them are about goals, which points to matches that tend to be open and high scoring.
Overall, 2 of 5 of York City's top markets land more often than they do for the typical National League club, by more than chance would explain, so they look like real tendencies for York City.
Some of these markets rest on fewer than 30 matches, so treat them as a rough guide. These are past frequencies, not predictions. A market that lands often is usually already priced short by bookmakers, so a high strike rate does not make it a profitable bet. Use the figures to see what is normal for York City, then compare them with the odds on offer.
Gambling can be addictive. 18+ only. Responsible gambling.
Squad
Goalkeepers 2
| # | Player | Saves | CS | Mins | Starts |
|---|---|---|---|---|---|
| 1 |
A. McNally
Alfie McNally
|
38 | 3 | 1278 | 14 |
| 31 |
G. Sykes-Kenworthy
George Sykes-Kenworthy
|
- | - | - | - |


CS clean sheets · Mins minutes played
Defenders 8
| # | Player | Tkl | Int | Duels | CS | Fls | Yel | Mins | Starts |
|---|---|---|---|---|---|---|---|---|---|
| 2 |
R. Fallowfield
Ryan Fallowfield
|
13 | 23 | 32 | 5 | 10 | 1 | 995 | 11 |
| 3 |
M. Kitching
Mark Kitching
|
19 | 10 | 44 | 3 | 6 | 2 | 1242 | 14 |
| 4 |
Z. Medley
Zech Medley
|
2 | 1 | 9 | 3 | 2 | 0 | 61 | - |
| 5 |
Z. Johnson
Zak Johnson
|
9 | 11 | 48 | 3 | 6 | 0 | 944 | 11 |
| 12 |
H. Boyes
Harry Boyes
|
23 | 10 | 65 | 4 | 8 | 1 | 1235 | 14 |
| 15 |
J. King
Jeff King
|
9 | 2 | 20 | 5 | 4 | 1 | 372 | 3 |
| 24 |
M. Williams
Morgan Williams
|
7 | 5 | 26 | - | 12 | 4 | 487 | 5 |
| 32 |
J. Hunt
Jack Hunt
|
8 | 3 | 18 | 4 | 1 | 1 | 288 | 3 |


Tkl tackles · Int interceptions · Duels duels won · CS clean sheets · Fls fouls committed · Yel yellow cards · Mins minutes played
Midfielders 9
| # | Player | Ast | xA | KP | Goals | Tkl | Yel | Mins | Starts |
|---|---|---|---|---|---|---|---|---|---|
| 7 |
J. Grey
Joe Grey
|
1 | - | 14 | 1 | 18 | 2 | 1013 | 13 |
| 8 |
A. Hunt
Alex Hunt
|
2 | - | 21 | 2 | 22 | 1 | 1049 | 14 |
| 11 |
F. Maguire
Frankie Maguire
|
0 | - | 0 | 0 | 6 | 1 | 214 | 1 |
| 16 |
A. Read
Arthur Read
|
1 | - | 6 | 1 | 11 | 1 | 436 | 2 |
| 17 |
C. Hewitt
Craig Hewitt
|
0 | - | 0 | 0 | 0 | 0 | 38 | - |
| 21 |
H. Boateng
Hiram Boateng
|
0 | - | 0 | 0 | 3 | 2 | 88 | 1 |
| 23 |
J. Felix
Joe Felix
|
2 | - | 10 | 0 | 18 | 0 | 719 | 9 |
| 28 |
O. Banks
Ollie Banks
|
0 | - | 14 | 1 | 13 | 3 | 1076 | 13 |
| 30 |
A. Newby
Alex Newby
|
1 | - | 6 | 6 | 7 | 0 | 804 | 9 |


Ast assists · xA expected assists · KP key passes · Tkl tackles · Yel yellow cards · Mins minutes played
Forwards 5
| # | Player | Goals | xG | Shots | SoT | Ast | Mins | Starts |
|---|---|---|---|---|---|---|---|---|
| 9 |
J. Stones
Josh Stones
|
0 | - | 2 | 0 | 0 | 98 | 1 |
| 10 |
O. Pearce
Ollie Pearce
|
6 | - | 29 | 12 | 4 | 1208 | 14 |
| 18 |
J. Malcolm
Jovan Malcolm
|
3 | - | 8 | 5 | 0 | 265 | 1 |
| 20 |
A. Akinyemi
Afolabi Akinyemi
|
0 | - | 1 | 1 | 0 | 43 | 1 |
| 25 |
B. Farrar
Ben Farrar
|
- | - | - | - | - | - | - |


xG expected goals · SoT shots on target · Ast assists · Mins minutes played
Scroll a table sideways for every column
Squad data (name, position, shirt number, photo) is from Bzzoiro Sports Data. Season stat columns that source does not carry show as ‘-’ rather than a misleading zero.
Season Player Statistics
Goals
- O. Pearce 0 0 0 6 14
- A. Newby 0 – 0 6 9
- J. Malcolm – – 0 3 1
Most carded
- M. Williams – 1 – 4Y 5
- H. Boateng 0 3 – 2Y 1R 1
- O. Pearce 0 1 0 3Y 14
Most fouls committed
- O. Banks 1 0 – 16 13
- M. Williams – 1 – 12 5
- O. Pearce 0 1 1 10 14
Most tackles
- H. Boyes 3 3 2 23 14
- A. Hunt 1 1 4 22 14
- M. Kitching 1 2 1 19 14
Most interceptions
- R. Fallowfield 2 1 2 23 11
- Z. Johnson 1 0 0 11 11
- M. Kitching 0 1 2 10 14
Most blocked shots
- R. Fallowfield 2 0 2 11 11
- Z. Johnson 0 2 1 11 11
- M. Kitching 3 0 0 8 14
Head to head
York City’s record against every other League Two club, in table order, across all league meetings on file.
 Salford City
 Fleetwood Town
 Crawley Town
Scroll the table sideways for every column
Latest news
All League Two newsArticles that mention York City.