




































































 New Zealand
21st in the International Friendlies table on 11 points from 8 games played. Squad, fixtures, expected XI and performance record.
Form
Last 6 results, most recent last.
DWDLWWPrevious fixtures
Full match history on file for New Zealand, most recent first. Select a row for the full match page.
| Date | Opponent | Score | Result | Competition | Shots | Match page | |
|---|---|---|---|---|---|---|---|
| 15 Nov 26 | Home |  India |
3–0 | W | International Friendlies | - | |
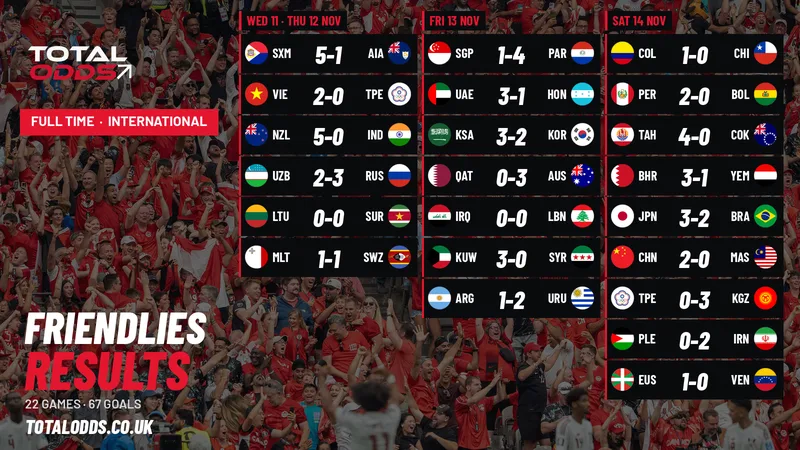
| 12 Nov 26 | Home | India |
5–0 | W | International Friendlies | - | |
| 05 Oct 26 | Away |  Japan |
1–2 | L | International Friendlies | 3 (1 on target) | |
| 01 Oct 26 | Away |  Panama |
1–1 | D | International Friendlies | - | |
| 27 Sep 26 | Away |  China |
3–0 | W | International Friendlies | 13 (6 on target) | |
| 24 Sep 26 | Away |  Palestine |
2–2 | D | International Friendlies | - | |
| 27 Jun 26 | Home |  Belgium |
1–5 | L | World Cup | 6 (2 on target) | |
| 22 Jun 26 | Home |  Egypt |
1–3 | L | World Cup | 11 (5 on target) | |
| 16 Jun 26 | Away |  Iran |
2–2 | D | World Cup | 14 (8 on target) | |
| 06 Jun 26 | Away |  England |
0–1 | L | International Friendlies | 3 (1 on target) | |
| 03 Jun 26 | Away |  Haiti |
0–4 | L | International Friendlies | 12 (3 on target) | |
| 19 Nov 25 | Away |  Ecuador |
0–2 | L | International Friendlies | 10 (2 on target) | |
| 16 Nov 25 | Away |  Colombia |
1–2 | L | International Friendlies | 10 (3 on target) | |
| 14 Oct 25 | Away |  Norway |
1–1 | D | International Friendlies | 9 (5 on target) | |
| 09 Oct 25 | Away |  Poland |
0–1 | L | International Friendlies | 12 (4 on target) | |
| 09 Sep 25 | Home |  Australia |
1–3 | L | International Friendlies | - | |
| 05 Sep 25 | Away | Australia |
0–1 | L | International Friendlies | - | |
| 10 Jun 25 | Home |  Ukraine |
1–2 | L | International Friendlies | - | |
| 07 Jun 25 | Home |  Côte d'Ivoire |
1–0 | W | International Friendlies | - | |
| 24 Mar 25 | Away |  New Caledonia |
3–0 | W | WC Qualifying: OFC | - | |
| 21 Mar 25 | Home |  Fiji |
7–0 | W | WC Qualifying: OFC | - | |
| 18 Nov 24 | Away |  Samoa |
8–0 | W | WC Qualifying: OFC | - | |
| 15 Nov 24 | Home |  Vanuatu |
8–1 | W | WC Qualifying: OFC | - | |
| 14 Oct 24 | Home |  Malaysia |
4–0 | W | International Friendlies | - | |
| 11 Oct 24 | Home |  Tahiti |
3–0 | W | WC Qualifying: OFC | - | |
| 10 Sep 24 | Away |  USA |
1–1 | D | International Friendlies | - | |
| 08 Sep 24 | Away |  Mexico |
0–3 | L | International Friendlies | - | |
| 26 Mar 24 | Home |  Tunisia |
0–0 | D | International Friendlies | - | |
| 22 Mar 24 | Away | Egypt |
0–1 | L | International Friendlies | - | |
| 21 Nov 23 | Away |  Ireland |
1–1 | D | International Friendlies | - | |
| 17 Nov 23 | Away |  Greece |
0–2 | L | International Friendlies | - | |
| 17 Oct 23 | Away | Australia |
0–2 | L | International Friendlies | - | |
| 13 Oct 23 | Home |  DR Congo |
1–1 | D | International Friendlies | - | |
| 16 Jun 23 | Away |  Sweden |
1–4 | L | International Friendlies | - | |
| 26 Mar 23 | Home | China |
2–1 | W | International Friendlies | - | |
| 23 Mar 23 | Home | China |
0–0 | D | International Friendlies | - | |
| 25 Sep 22 | Home | Australia |
0–2 | L | International Friendlies | - | |
| 22 Sep 22 | Away | Australia |
0–1 | L | International Friendlies | - | |
| 09 Jun 22 | Home |  Oman |
0–0 | D | International Friendlies | - | |
| 05 Jun 22 | Away |  Peru |
0–1 | L | International Friendlies | - | |
| 30 Mar 22 | Away |  Solomon Islands |
5–0 | W | WC Qualifying: OFC | - | |
| 27 Mar 22 | Home | Tahiti |
1–0 | W | WC Qualifying: OFC | - | |
| 24 Mar 22 | Home | New Caledonia |
7–1 | W | WC Qualifying: OFC | - | |
| 21 Mar 22 | Home | Fiji |
4–0 | W | WC Qualifying: OFC | - | |
| 18 Mar 22 | Away |  Papua New Guinea |
1–0 | W | WC Qualifying: OFC | - | |
| 28 Jan 22 | Away |  Jordan |
1–3 | L | International Friendlies | - | |
| 16 Nov 21 | Home |  Gambia |
2–0 | W | International Friendlies | - | |
| 12 Oct 21 | Away |  Bahrain |
1–0 | W | International Friendlies | - | |
| 09 Oct 21 | Away |  Curaçao |
2–1 | W | International Friendlies | - | |
| 17 Nov 19 | Away |  Lithuania |
0–1 | L | International Friendlies | - | |
| 14 Nov 19 | Away | Ireland |
1–3 | L | International Friendlies | - | |
| 24 Mar 18 | Away |  Canada |
0–1 | L | International Friendlies | - |
Scroll the table sideways for every column
Season Statistics
Games Played: 8
PPG ?Points per game this season (win = 3, draw = 1, loss = 0), with the win/draw/loss split behind it.
- Win · 3 (38%)
- Draw · 2 (25%)
- Loss · 3 (38%)
Clean Sheets ?How often this team has kept a clean sheet (conceded zero goals) this season.
- Yes · 3 (38%)
- No · 5 (62%)
BTTS ?Both Teams To Score: how often this team's matches have seen both sides get on the scoresheet this season.
- Yes · 3 (38%)
- No · 5 (62%)
O/U 2.5 Goals ?How often this team's matches have finished with more (Over) or fewer (Under) than 2.5 total goals this season.
- Over · 6 (75%)
- Under · 2 (25%)
O/U 9.5 Corners ?How often this team's matches have finished with more (Over) or fewer (Under) than 9.5 total corners this season.
- Over · 1 (25%)
- Under · 3 (75%)
Lineup & availability
New Zealand
4-2-3-1
Starting XI


Out / doubtful
- D. Wilkins Injured · Sonderjyske: Back 30 Nov
- L. Brooke-Smith Injured · Portsmouth: Ankle injury


All-time record
Recent form (Last 6)
21st in the league phase · 11 pts
| Results | PPG | |
|---|---|---|
| Overall | DWDLWW | 1.83 |
| Home* | LLLLWW | 1.00 |
| Away | LLDWDL | 0.83 |
* not enough games played in this league yet. It includes recent matches from other divisions to fill out the sample.
Career Overall
| Overall | Home | Away | |
|---|---|---|---|
| Win % | 37% | 57% | 23% |
| Goals/game (both sides) | 2.90 | 3.38 | 2.58 |
| Scored/game | 1.69 | 2.48 | 1.16 |
| Conceded/game | 1.21 | 0.90 | 1.42 |
| Both teams scored | 38% | 38% | 39% |
| Clean sheets | 35% | 57% | 19% |
| Failed to score | 33% | 19% | 42% |
| xG/game | 0.99 | 0.86 | 1.24 |
| xG against/game | 2.37 | 2.80 | 1.50 |
| npxG/game | 0.99 | 0.86 | 1.24 |
| Led at half-time | 31% | 52% | 16% |
| Comebacks (trailed at HT, won) | 0% | 0% | 0% |
Historic Bets
New Zealand’s 5 most frequent betting markets, based on its entire match history on file.
- 1 Over 7.5 Corners in the Match 81.8% Based on 11 matches on file · League average 62.9% +19 pts
- 2 Over 8.5 Shots on Target in the Match 72.7% Based on 11 matches on file · League average 39.7% +33 pts
- 3 Over 1.5 Goals in the Match 71.2% Based on 52 matches on file · League average 70.4% +1 pts
- 4 To Score 67.3% Based on 52 matches on file · League average 66.7% +1 pts
- 5 1st Half Over 0.5 Goals 67.3% Based on 52 matches on file · League average 68.2% -1 pts
New Zealand betting trends at a glance In line with average
Over 11 matches on file, New Zealand's most frequent betting market is Over 7.5 Corners in the Match, which has landed 81.8% of the time. Over 8.5 Shots on Target in the Match (72.7%) and Over 1.5 Goals in the Match (71.2%) follow, with To Score and 1st Half Over 0.5 Goals completing the top 5.
None of these markets differs from the average side in the same division by more than chance could explain at this sample size, so none of them sets New Zealand apart.
Overall, New Zealand's top markets land about as often as they do for the typical club in the same division. These are common league outcomes rather than something particular to New Zealand, and gaps like these are within normal variation at this sample size.
Some of these markets rest on fewer than 30 matches, so treat them as a rough guide. These are past frequencies, not predictions. A market that lands often is usually already priced short by bookmakers, so a high strike rate does not make it a profitable bet. Use the figures to see what is normal for New Zealand, then compare them with the odds on offer.
Gambling can be addictive. 18+ only. Responsible gambling.
Squad
Goalkeepers 3
| # | Player | Saves | CS | Mins | Starts |
|---|---|---|---|---|---|
| 1 |
A. Paulsen
Alex Paulsen
|
- | - | 716 | 8 |
| 1 |
M. Woud
Michael Woud
|
- | - | 90 | 1 |
| 15 |
M. Crocombe
Max Crocombe
|
- | - | 934 | 10 |


CS clean sheets · Mins minutes played
Defenders 10
| # | Player | Tkl | Int | Duels | CS | Fls | Yel | Mins | Starts |
|---|---|---|---|---|---|---|---|---|---|
| 4 |
N. Pijnaker
Nando Pijnaker
|
- | - | - | - | - | 0 | 95 | 1 |
| 4 |
T. Payne
Tim Payne
|
- | - | - | - | - | 0 | 634 | 9 |
| 11 |
B. Old
Benjamin Old
|
- | - | - | - | - | 0 | 740 | 6 |
| 13 |
D. Wilkins
Injured
|
- | - | - | - | - | 0 | 84 | 0 |
| 14 |
G. Stanger
George Stanger
|
- | - | - | - | - | 0 | 250 | 2 |
| 15 |
F. De Vries
Francis De Vries
|
- | - | - | - | - | 2 | 719 | 8 |
| 15 |
M. Boxall
Michael Boxall
|
- | - | - | - | - | 2 | 1086 | 11 |
| 17 |
C. Elliot
Callan Elliot
|
- | - | - | - | - | 0 | 458 | 3 |
| 20 |
F. Surman
Finn Surman
|
- | - | - | - | - | 0 | 1180 | 13 |
| 44 |
T. Bindon
Tyler Bindon
|
- | - | - | - | - | 2 | 931 | 10 |


Tkl tackles · Int interceptions · Duels duels won · CS clean sheets · Fls fouls committed · Yel yellow cards · Mins minutes played
Midfielders 13
| # | Player | Ast | xA | KP | Goals | Tkl | Yel | Mins | Starts |
|---|---|---|---|---|---|---|---|---|---|
| 6 |
M. Stamenić
Marko Stamenić
|
- | - | - | 2 | - | 3 | 1244 | 14 |
| 8 |
E. Just
Elijah Just
|
- | - | - | 4 | - | 3 | 1104 | 14 |
| 8 |
J. Bell
Joe Bell
|
- | - | - | 0 | - | 2 | 740 | 9 |
| 10 |
L. Bayliss
Lachlan Bayliss
|
- | - | - | 1 | - | 2 | 305 | 3 |
| 10 |
S. Singh
Sarpreet Singh
|
- | - | - | 0 | - | 2 | 997 | 13 |
| 13 |
L. Cacace
Liberato Cacace
|
- | - | - | 0 | - | 0 | 511 | 7 |
| 14 |
A. Rufer
Alex Rufer
|
- | - | - | 0 | - | 1 | 639 | 6 |
| 18 |
C. McCowatt
Callum McCowatt
|
- | - | - | 0 | - | 2 | 599 | 7 |
| 21 |
J. Randall
Jesse Randall
|
- | - | - | 3 | - | 0 | 567 | 5 |
| 23 |
O. P. Price
Owen Parker-Price
|
- | - | - | 1 | - | 0 | 223 | 2 |
| 27 |
L. Rogerson
Logan Rogerson
|
- | - | - | 0 | - | 0 | 342 | 4 |
| 28 |
M. Garbett
Matthew Garbett
|
- | - | - | 0 | - | 2 | 561 | 7 |
| 30 |
R. Thomas
Ryan Thomas
|
- | - | - | 0 | - | 0 | 364 | 5 |


Ast assists · xA expected assists · KP key passes · Tkl tackles · Yel yellow cards · Mins minutes played
Forwards 3
| # | Player | Goals | xG | Shots | SoT | Ast | Mins | Starts |
|---|---|---|---|---|---|---|---|---|
| 9 | 3 | - | - | - | - | 928 | 12 | |
| 19 |
B. Waine
Ben Waine
|
2 | - | - | - | - | 525 | 6 |
| 28 |
L. Brooke-Smith
Injured
|
0 | - | - | - | - | 11 | 0 |

xG expected goals · SoT shots on target · Ast assists · Mins minutes played
Position not recorded 14
| # | Player | Goals | Yel | Mins | Starts |
|---|---|---|---|---|---|
| 0 | 0 | 18 | 0 | ||
| 0 | 0 | 414 | 6 | ||
| 0 | 0 | 35 | 0 | ||
| 0 | 0 | 221 | 2 | ||
| 1 | 0 | 136 | 1 | ||
| 0 | 0 | 262 | 2 | ||
| 0 | 0 | 30 | 0 | ||
| 0 | 0 | 18 | 0 | ||
| 0 | 0 | 91 | 1 | ||
| 0 | 0 | 70 | 0 | ||
| 0 | 0 | 45 | 0 | ||
| 0 | 0 | 151 | 1 | ||
| 0 | 0 | 21 | 0 | ||
| 0 | 0 | 73 | 0 |
Yel yellow cards · Mins minutes played
Scroll a table sideways for every column
Squad data (name, position, shirt number, photo) is from Bzzoiro Sports Data. Season stat columns that source does not carry show as ‘-’ rather than a misleading zero.
Season Player Statistics
Goals
- E. Just – – – 4 14
- F. Surman – – – 3 13
- Chris Wood – – – 3 12
Shots on target & total shots
Not available for this league yet.
Most carded
- M. Stamenić – – – 3Y 14
- E. Just – – – 3Y 14
- F. De Vries – – – 2Y 8
Most fouls committed
Not available for this league yet.
Tackles, interceptions & key passes
Not available for this league yet.
Head to head
New Zealand’s record against the national teams it has met, most often met first, across all meetings on file in any competition.
Scroll the table sideways for every column
Tournament history
How far New Zealand went in each completed edition of the competitions below, from the games on file.
| Edition | Result |
|---|---|
| World Cup 2026 | Group stage |
Latest news
All International Friendlies newsArticles that mention New Zealand.