































 Barcelona
vs
 Man City
Tue 08 Dec, 20:00 UTC · Matchday 6 · probabilities and historical statistics
Live Games
Predicted outcome
Event markets
This match League average
Predicted Score
Team comparison
- Barcelona
- Man City
Did you know?
- Barcelona's matches have gone over 1.5 goals in 10 of their last 10.
- Barcelona have outscored their xG by 0.97 goals per game over their last 10. Finishing that hot rarely keeps up.
- Both teams have scored in 8 of Barcelona's last 10 matches.
- Barcelona's matches have gone over 2.5 goals in 8 of their last 10.
H2H
These two have not met in the Champions League in the stored history, which goes back to 2024/25.
How they play
Each line runs across the 25 clubs of the competition, from up to the last 19 competition games of each. A marker at either end means the most or least of that measure.
Barcelona
- Keeps the ball
- Open play side
- Plays on the floor
Man City
- Keeps the ball
- Set piece heavy
-
PossessionCedes the ballKeeps the ball
64% 1st of 18 60% 4th of 18
-
Shot selectionShoots on sightWaits for the chance
0.11 xG a shot 18th of 25 0.12 xG a shot 11th of 25
-
Set piecesOpen playSet pieces
13% of xG 24th of 25 23% of xG 6th of 25
-
Route to goalOn the groundCrosses and headers
8% of shots 23rd of 25 15% of shots 14th of 25
Where they differ
- Man City get more of their chances from set pieces than Barcelona, 23% against 13%.
- Man City go more through the air than Barcelona, 15% of shots against 8%.
Ball Stats (Last 10 games)
Barcelona
Man City
Disciplinary/Tackles (Last 10 games)
Barcelona
Man City
Previous Game Statistics (Last 10)
- Under · 0 (0%)
- Over · 10 (100%)
- Under · 4 (40%)
- Over · 6 (60%)
- Under · 2 (20%)
- Over · 8 (80%)
- Under · 6 (60%)
- Over · 4 (40%)
- Under · 4 (40%)
- Over · 6 (60%)
- Under · 7 (70%)
- Over · 3 (30%)
- Yes · 1 (10%)
- No · 9 (90%)
- Yes · 8 (80%)
- No · 2 (20%)
- Under · 0 (0%)
- Over · 10 (100%)
- Under · 2 (20%)
- Over · 8 (80%)
- Under · 3 (30%)
- Over · 7 (70%)
- Under · 4 (40%)
- Over · 6 (60%)
- Under · 6 (60%)
- Over · 4 (40%)
- Under · 4 (40%)
- Over · 6 (60%)
- Yes · 2 (20%)
- No · 8 (80%)
- Yes · 6 (60%)
- No · 4 (40%)
- Under · 0 (0%)
- Over · 10 (100%)
- Under · 2 (25%)
- Over · 6 (75%)
- Under · 1 (10%)
- Over · 9 (90%)
- Under · 4 (50%)
- Over · 4 (50%)
- Under · 4 (40%)
- Over · 6 (60%)
- Under · 5 (62%)
- Over · 3 (38%)
- Yes · 2 (20%)
- No · 8 (80%)
- Yes · 7 (70%)
- No · 3 (30%)
- Under · 0 (0%)
- Over · 10 (100%)
- Under · 3 (43%)
- Over · 4 (57%)
- Under · 3 (30%)
- Over · 7 (70%)
- Under · 4 (57%)
- Over · 3 (43%)
- Under · 5 (50%)
- Over · 5 (50%)
- Under · 4 (57%)
- Over · 3 (43%)
- Yes · 2 (20%)
- No · 8 (80%)
- Yes · 6 (60%)
- No · 4 (40%)
Barcelona
Previous 10 Matches
WWWWWWLLWW-
03 Nov 26 H Barcelona vs
 Aston Villa
3–0
W
View all statisticsBarcelona
Aston Villa
16 Shots 98 Shots on Target 14 Corners 81 Yellow Cards 30 Red Cards 0
-
31 Oct 26 H Barcelona vs
 Alaves
6–1
W
View all statisticsBarcelona
Alaves
13 Shots 77 Shots on Target 33 Corners 32 Yellow Cards 30 Red Cards 0
-
25 Oct 26 H Barcelona vs
 Real Madrid
1–2
L
View all statisticsBarcelona
Real Madrid
18 Shots 106 Shots on Target 56 Corners 63 Yellow Cards 30 Red Cards 0
-
20 Oct 26 A Barcelona vs
 Paris Saint-Germain
2–4
L
View all statisticsParis Saint-Germain
Barcelona
22 Shots 1814 Shots on Target 52 Corners 30 Yellow Cards 10 Red Cards 0
-
17 Oct 26 A Barcelona vs
 Real Betis
5–2
W
View all statisticsReal Betis
Barcelona
6 Shots 185 Shots on Target 102 Corners 53 Yellow Cards 21 Red Cards 0
-
13 Oct 26 A Barcelona vs
Galatasaray 4–1 W
View all statisticsBarcelona
5 Shots 223 Shots on Target 111 Corners 62 Yellow Cards 00 Red Cards 0 -
10 Oct 26 H Barcelona vs
 Getafe
3–0
W
View all statisticsBarcelona
Getafe
23 Shots 48 Shots on Target 19 Corners 22 Yellow Cards 40 Red Cards 0
-
19 Sep 26 A Barcelona vs
 Sevilla
3–1
W
View all statisticsSevilla
Barcelona
7 Shots 243 Shots on Target 71 Corners 31 Yellow Cards 00 Red Cards 0
-
16 Sep 26 H Barcelona vs
Racing Santander 7–2 W
View all statisticsBarcelona
30 Shots 59 Shots on Target 318 Corners 03 Yellow Cards 20 Red Cards 0 -
13 Sep 26 A Barcelona vs
 Levante
4–2
W
View all statisticsLevante
Barcelona
13 Shots 127 Shots on Target 63 Corners 51 Yellow Cards 10 Red Cards 0
Previous 10 Matches
WWWWWWWLWW-
03 Nov 26 H Barcelona vs
Aston Villa
3–0
W
View all statisticsBarcelona
Aston Villa
16 Shots 98 Shots on Target 14 Corners 81 Yellow Cards 30 Red Cards 0 -
31 Oct 26 H Barcelona vs
Alaves
6–1
W
View all statisticsBarcelona
Alaves
13 Shots 77 Shots on Target 33 Corners 32 Yellow Cards 30 Red Cards 0 -
25 Oct 26 H Barcelona vs
Real Madrid
1–2
L
View all statisticsBarcelona
Real Madrid
18 Shots 106 Shots on Target 56 Corners 63 Yellow Cards 30 Red Cards 0 -
10 Oct 26 H Barcelona vs
Getafe
3–0
W
View all statisticsBarcelona
Getafe
23 Shots 48 Shots on Target 19 Corners 22 Yellow Cards 40 Red Cards 0 -
16 Sep 26 H Barcelona vs
View all statisticsBarcelona
30 Shots 59 Shots on Target 318 Corners 03 Yellow Cards 20 Red Cards 0 -
09 Sep 26 H Barcelona vs
Feyenoord 5–1 W
View all statisticsBarcelona
24 Shots 49 Shots on Target 24 Corners 11 Yellow Cards 10 Red Cards 0 -
31 Aug 26 H Barcelona vs
 Rayo Vallecano
5–2
W
View all statisticsBarcelona
Rayo Vallecano
26 Shots 119 Shots on Target 59 Corners 50 Yellow Cards 10 Red Cards 0
-
27 Aug 26 H Barcelona vs
 Athletic Bilbao
2–0
W
View all statisticsBarcelona
Athletic Bilbao
22 Shots 510 Shots on Target 012 Corners 51 Yellow Cards 20 Red Cards 0
-
17 May 26 H Barcelona vs
Real Betis
3–1
W
View all statisticsBarcelona
Real Betis
15 Shots 79 Shots on Target 26 Corners 41 Yellow Cards 00 Red Cards 0 -
10 May 26 H Barcelona vs
Real Madrid
2–0
W
View all statisticsBarcelona
Real Madrid
10 Shots 87 Shots on Target 14 Corners 82 Yellow Cards 40 Red Cards 0
Previous 10 Matches
WLLWWWWWWL-
20 Oct 26 A Barcelona vs
Paris Saint-Germain
2–4
L
View all statisticsParis Saint-Germain
Barcelona
22 Shots 1814 Shots on Target 52 Corners 30 Yellow Cards 10 Red Cards 0 -
17 Oct 26 A Barcelona vs
Real Betis
5–2
W
View all statisticsReal Betis
Barcelona
6 Shots 185 Shots on Target 102 Corners 53 Yellow Cards 21 Red Cards 0 -
13 Oct 26 A Barcelona vs
View all statisticsBarcelona
5 Shots 223 Shots on Target 111 Corners 62 Yellow Cards 00 Red Cards 0 -
19 Sep 26 A Barcelona vs
Sevilla
3–1
W
View all statisticsSevilla
Barcelona
7 Shots 243 Shots on Target 71 Corners 31 Yellow Cards 00 Red Cards 0 -
13 Sep 26 A Barcelona vs
Levante
4–2
W
View all statisticsLevante
Barcelona
13 Shots 127 Shots on Target 63 Corners 51 Yellow Cards 10 Red Cards 0 -
06 Sep 26 A Barcelona vs
 Valencia
5–0
W
View all statisticsValencia
Barcelona
3 Shots 252 Shots on Target 101 Corners 41 Yellow Cards 30 Red Cards 0
-
23 Aug 26 A Barcelona vs
 Elche
5–0
W
View all statisticsElche
Barcelona
7 Shots 112 Shots on Target 73 Corners 11 Yellow Cards 00 Red Cards 0
-
23 May 26 A Barcelona vs
Valencia
1–3
L
View all statisticsValencia
Barcelona
19 Shots 116 Shots on Target 47 Corners 82 Yellow Cards 20 Red Cards 0 -
13 May 26 A Barcelona vs
Alaves
0–1
L
View all statisticsAlaves
Barcelona
9 Shots 83 Shots on Target 06 Corners 41 Yellow Cards 20 Red Cards 0 -
02 May 26 A Barcelona vs
 Osasuna
2–1
W
View all statisticsOsasuna
Barcelona
9 Shots 134 Shots on Target 43 Corners 72 Yellow Cards 20 Red Cards 0
Form & stats (Last 10)
5th in the league phase · 9 pts
| Results | PPG | |
|---|---|---|
| Overall | WWDWLWWWLW | 2.20 |
| Home | WDLWWWWLWW | 2.20 |
| Away | LLWDLWDWWL | 1.40 |
All time statistics
| Overall | Home | Away | |
|---|---|---|---|
| Win % | 69% | 77% | 61% |
| Goals/game (both sides) | 3.37 | 3.47 | 3.26 |
| Scored/game | 2.35 | 2.60 | 2.10 |
| Conceded/game | 1.02 | 0.87 | 1.16 |
| Both teams scored | 55% | 51% | 58% |
| Clean sheets | 40% | 45% | 34% |
| Failed to score | 9% | 6% | 12% |
| xG/game | 2.26 | 2.51 | 2.01 |
| xG against/game | 1.12 | 0.98 | 1.26 |
| npxG/game | 2.11 | 2.32 | 1.90 |
| Deep completions/game | 11.2 | 12.4 | 10.0 |
| PPDA (press intensity) | 8.2 | 8.0 | 8.4 |
| Led at half-time | 48% | 57% | 38% |
| Comebacks (trailed at HT, won) | 30% | 26% | 32% |
Man City
Previous 10 Matches
WWWLWWLLWL-
07 Nov 26 A Man City vs
 Nott'm Forest
1–3
L
-
04 Nov 26 A Man City vs
 RB Leipzig
3–2
W
View all statisticsRB Leipzig
Man City
14 Shots 126 Shots on Target 55 Corners 34 Yellow Cards 20 Red Cards 0
-
31 Oct 26 H Man City vs
 Brighton
0–1
L
View all statisticsMan City
Brighton
21 Shots 76 Shots on Target 38 Corners 20 Yellow Cards 30 Red Cards 0
-
24 Oct 26 A Man City vs
Aston Villa
1–2
L
View all statisticsAston Villa
Man City
8 Shots 152 Shots on Target 74 Corners 74 Yellow Cards 40 Red Cards 0 -
20 Oct 26 H Man City vs
AEK Athens 5–1 W
View all statisticsMan City
17 Shots 117 Shots on Target 38 Corners 31 Yellow Cards 00 Red Cards 0 -
17 Oct 26 H Man City vs
Ipswich 3–2 W
View all statisticsMan City
19 Shots 86 Shots on Target 32 Corners 31 Yellow Cards 20 Red Cards 0 -
14 Oct 26 H Man City vs
Paris Saint-Germain
2–4
L
View all statisticsMan City
Paris Saint-Germain
27 Shots 159 Shots on Target 1011 Corners 21 Yellow Cards 10 Red Cards 0 -
11 Oct 26 A Man City vs
 Liverpool
3–0
W
View all statisticsLiverpool
Man City
13 Shots 156 Shots on Target 45 Corners 64 Yellow Cards 21 Red Cards 0
-
20 Sep 26 H Man City vs
 Sunderland
5–3
W
View all statisticsMan City
Sunderland
16 Shots 176 Shots on Target 96 Corners 50 Yellow Cards 10 Red Cards 0
-
13 Sep 26 A Man City vs
 Man United
1–0
W
View all statisticsMan United
Man City
16 Shots 63 Shots on Target 26 Corners 71 Yellow Cards 20 Red Cards 1
Previous 10 Matches
WWLWWWLWWL-
31 Oct 26 H Man City vs
Brighton
0–1
L
View all statisticsMan City
Brighton
21 Shots 76 Shots on Target 38 Corners 20 Yellow Cards 30 Red Cards 0 -
20 Oct 26 H Man City vs
View all statisticsMan City
17 Shots 117 Shots on Target 38 Corners 31 Yellow Cards 00 Red Cards 0 -
17 Oct 26 H Man City vs
View all statisticsMan City
19 Shots 86 Shots on Target 32 Corners 31 Yellow Cards 20 Red Cards 0 -
14 Oct 26 H Man City vs
Paris Saint-Germain
2–4
L
View all statisticsMan City
Paris Saint-Germain
27 Shots 159 Shots on Target 1011 Corners 21 Yellow Cards 10 Red Cards 0 -
20 Sep 26 H Man City vs
Sunderland
5–3
W
View all statisticsMan City
Sunderland
16 Shots 176 Shots on Target 96 Corners 50 Yellow Cards 10 Red Cards 0 -
05 Sep 26 H Man City vs
Coventry 1–0 W
View all statisticsMan City
15 Shots 124 Shots on Target 34 Corners 51 Yellow Cards 20 Red Cards 0 -
23 Aug 26 H Man City vs
 Bournemouth
2–1
W
View all statisticsMan City
Bournemouth
13 Shots 56 Shots on Target 48 Corners 31 Yellow Cards 20 Red Cards 0
-
24 May 26 H Man City vs
Aston Villa
1–2
L
View all statisticsMan City
Aston Villa
16 Shots 123 Shots on Target 59 Corners 41 Yellow Cards 00 Red Cards 0 -
13 May 26 H Man City vs
 Crystal Palace
3–0
W
View all statisticsMan City
Crystal Palace
15 Shots 64 Shots on Target 29 Corners 40 Yellow Cards 20 Red Cards 0
-
09 May 26 H Man City vs
 Brentford
3–0
W
View all statisticsMan City
Brentford
25 Shots 410 Shots on Target 210 Corners 24 Yellow Cards 20 Red Cards 0
Previous 10 Matches
WDDWWWWLWL-
07 Nov 26 A Man City vs
Nott'm Forest
1–3
L
-
04 Nov 26 A Man City vs
RB Leipzig
3–2
W
View all statisticsRB Leipzig
Man City
14 Shots 126 Shots on Target 55 Corners 34 Yellow Cards 20 Red Cards 0 -
24 Oct 26 A Man City vs
Aston Villa
1–2
L
View all statisticsAston Villa
Man City
8 Shots 152 Shots on Target 74 Corners 74 Yellow Cards 40 Red Cards 0 -
11 Oct 26 A Man City vs
Liverpool
3–0
W
View all statisticsLiverpool
Man City
13 Shots 156 Shots on Target 45 Corners 64 Yellow Cards 21 Red Cards 0 -
13 Sep 26 A Man City vs
Man United
1–0
W
View all statisticsMan United
Man City
16 Shots 63 Shots on Target 26 Corners 71 Yellow Cards 20 Red Cards 1 -
08 Sep 26 A Man City vs
Porto 2–0 W
View all statisticsMan City
5 Shots 200 Shots on Target 102 Corners 51 Yellow Cards 30 Red Cards 0 -
28 Aug 26 A Man City vs
Crystal Palace
4–1
W
View all statisticsCrystal Palace
Man City
9 Shots 181 Shots on Target 92 Corners 61 Yellow Cards 20 Red Cards 0 -
19 May 26 A Man City vs
Bournemouth
1–1
D
View all statisticsBournemouth
Man City
10 Shots 142 Shots on Target 57 Corners 64 Yellow Cards 20 Red Cards 0 -
04 May 26 A Man City vs
 Everton
3–3
D
View all statisticsEverton
Man City
14 Shots 216 Shots on Target 45 Corners 94 Yellow Cards 10 Red Cards 0
-
22 Apr 26 A Man City vs
Burnley 1–0 W
View all statisticsMan City
9 Shots 281 Shots on Target 93 Corners 110 Yellow Cards 00 Red Cards 0
Form & stats (Last 10)
7th in the league phase · 9 pts
| Results | PPG | |
|---|---|---|
| Overall | LWLWLLWLWW | 1.50 |
| Home | DWLWWLWLLW | 1.60 |
| Away | LLLDWWLLWW | 1.30 |
All time statistics
| Overall | Home | Away | |
|---|---|---|---|
| Win % | 69% | 76% | 61% |
| Goals/game (both sides) | 3.27 | 3.58 | 2.95 |
| Scored/game | 2.33 | 2.69 | 1.98 |
| Conceded/game | 0.93 | 0.89 | 0.98 |
| Both teams scored | 51% | 53% | 49% |
| Clean sheets | 42% | 43% | 41% |
| Failed to score | 10% | 7% | 14% |
| xG/game | 2.27 | 2.44 | 2.10 |
| xG against/game | 0.99 | 0.91 | 1.07 |
| npxG/game | 2.12 | 2.26 | 1.97 |
| Deep completions/game | 12.6 | 13.5 | 11.7 |
| PPDA (press intensity) | 10.6 | 10.2 | 11.0 |
| Led at half-time | 56% | 65% | 48% |
| Comebacks (trailed at HT, won) | 24% | 33% | 18% |
League standings
Barcelona are 5th with 9 points. Man City are 7th with 9 points.
| # | Team | P | W | D | L | GF | GA | GD | Pts |
|---|---|---|---|---|---|---|---|---|---|
| 1 | Paris Saint-Germain |
4 | 4 | 0 | 0 | 20 | 5 | +15 | 12 |
| 2 | Real Madrid |
4 | 4 | 0 | 0 | 13 | 7 | +6 | 12 |
| 3 |  Arsenal |
4 | 3 | 1 | 0 | 8 | 3 | +5 | 10 |
| 4 |  Como |
4 | 3 | 0 | 1 | 19 | 6 | +13 | 9 |
| 5 | Barcelona |
4 | 3 | 0 | 1 | 14 | 6 | +8 | 9 |
| 6 | Aston Villa |
4 | 3 | 0 | 1 | 12 | 6 | +6 | 9 |
| 7 | Man City |
4 | 3 | 0 | 1 | 12 | 7 | +5 | 9 |
| 8 | Liverpool |
4 | 3 | 0 | 1 | 14 | 10 | +4 | 9 |
| 9 |  Club Brugge |
4 | 3 | 0 | 1 | 11 | 7 | +4 | 9 |
| 10 |  Sporting CP |
4 | 3 | 0 | 1 | 8 | 4 | +4 | 9 |
| 11 | Real Betis |
4 | 3 | 0 | 1 | 8 | 6 | +2 | 9 |
| 12 |  Borussia Dortmund |
4 | 3 | 0 | 1 | 7 | 5 | +2 | 9 |
| 13 |  Bayern Munich |
4 | 2 | 2 | 0 | 12 | 5 | +7 | 8 |
| 14 |  Stuttgart |
4 | 2 | 1 | 1 | 7 | 4 | +3 | 7 |
| 15 |  Inter |
4 | 2 | 0 | 2 | 8 | 6 | +2 | 6 |
| 16 |  LASK |
4 | 2 | 0 | 2 | 10 | 9 | +1 | 6 |
| 17 | Man United |
4 | 2 | 0 | 2 | 8 | 8 | +0 | 6 |
| 18 | Galatasaray |
4 | 2 | 0 | 2 | 8 | 9 | -1 | 6 |
| 19 |  Fenerbahce |
4 | 1 | 2 | 1 | 6 | 11 | -5 | 5 |
| 20 |  Roma |
4 | 1 | 1 | 2 | 10 | 8 | +2 | 4 |
| 21 |  Shakhtar Donetsk |
4 | 1 | 1 | 2 | 4 | 4 | +0 | 4 |
| 22 |  Viking |
4 | 1 | 1 | 2 | 9 | 10 | -1 | 4 |
| 23 |  Atletico Madrid |
4 | 1 | 1 | 2 | 4 | 5 | -1 | 4 |
| 24 |  PSV Eindhoven |
4 | 1 | 1 | 2 | 3 | 4 | -1 | 4 |
| 25 |  Bodo/Glimt |
4 | 1 | 1 | 2 | 4 | 9 | -5 | 4 |
| 26 | Porto |
4 | 1 | 0 | 3 | 6 | 7 | -1 | 3 |
| 27 |  Napoli |
4 | 1 | 0 | 3 | 6 | 11 | -5 | 3 |
| 28 |  Villarreal |
4 | 1 | 0 | 3 | 8 | 14 | -6 | 3 |
| 29 | RB Leipzig |
4 | 1 | 0 | 3 | 5 | 11 | -6 | 3 |
| 30 | AEK Athens |
4 | 1 | 0 | 3 | 5 | 11 | -6 | 3 |
| 31 |  Sabah |
4 | 1 | 0 | 3 | 4 | 10 | -6 | 3 |
| 32 | Feyenoord |
4 | 1 | 0 | 3 | 4 | 11 | -7 | 3 |
| 33 |  Lens |
4 | 1 | 0 | 3 | 4 | 16 | -12 | 3 |
| 34 |  Slavia Prague |
4 | 0 | 1 | 3 | 5 | 9 | -4 | 1 |
| 35 |  Lille |
4 | 0 | 1 | 3 | 4 | 10 | -6 | 1 |
| 36 |  Slovan Bratislava |
4 | 0 | 0 | 4 | 1 | 17 | -16 | 0 |
Scroll the table sideways for every column
Lineups & injuries
No expected XI available for Barcelona yet.
Out / doubtful
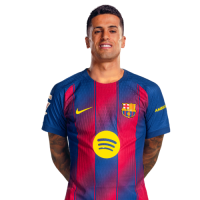
- João Cancelo Suspended · Yellow_card_accumulation_suspension (back 2026-11-14)
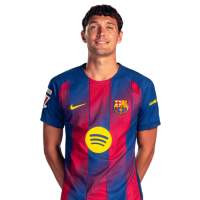
- Andreas Christensen Injured · Thigh injury (back 2026-11-20)
- Dani Olmo Injured · Thigh injury (back 2026-11-30)
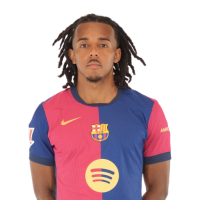
- Jules Koundé Injured · Sprained ankle (back 2026-11-30)
- Rodri Injured · Hamstring injury (back 2026-11-30)
- Roony Bardghji Injured · Cruciate ligament injury (back 2027-02-28)
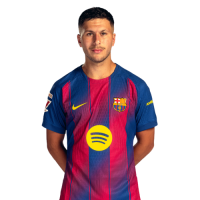
- Xavi Espart Injured · Ankle injury (back 2027-01-10)





Season Player Statistics
Each player’s numbers in their last 3 matches individually, next to their season total and appearances.
Goals
Scored this season
Barcelona
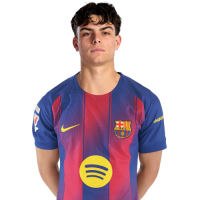
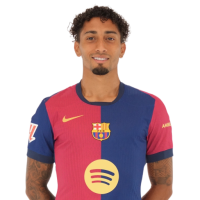
- Raphinha ––2 15 9
- Lamine Yamal ––1 10 11
- Fermín López ––0 5 8

Man City
- Erling Haaland ––1 9 10
- Rayan Cherki ––0 5 9
- Antoine Semenyo ––– 2 6

Shots on target
Efforts that tested the keeper
Barcelona
- Lamine Yamal ––3 19 11
- Raphinha ––2 19 9
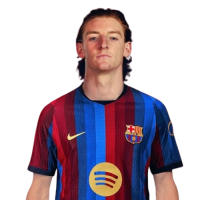
- Anthony Gordon ––1 12 10
Man City
- Erling Haaland ––3 18 10
- Rayan Cherki ––1 7 9
- Iliman Ndiaye ––0 6 9

Total shots
Every attempt on goal
Barcelona
- Lamine Yamal ––6 59 11
- Raphinha ––2 35 9
- Anthony Gordon ––3 22 10
Man City
- Erling Haaland ––3 38 10
- Rayan Cherki ––4 18 9
- Iliman Ndiaye ––0 17 9
Most carded
Yellow and red cards
Barcelona
- Fermín López ––0 3Y 8
- João Cancelo ––0 2Y 8
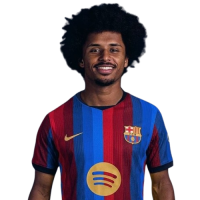
- Karim Adeyemi ––– 2Y 4
Man City
- Phil Foden ––0 1Y 1R 4
- Josko Gvardiol ––– 2Y 8
- Rayan Cherki ––0 2Y 9

Most fouls
Fouls committed
Barcelona
- Xavi Espart ––– 13 8
- Fermín López ––2 13 8
- Lamine Yamal ––4 12 11
Man City
- Elliot Anderson ––0 15 10
- Rúben Dias ––0 14 10
- Antoine Semenyo ––– 9 6


Most tackles
Tackles made
Barcelona
- Xavi Espart ––– 26 8
- Rodri ––1 20 10
- Eric García ––– 16 7
Man City
- Elliot Anderson ––7 21 10
- Josko Gvardiol ––– 19 8
- Abdukodir Khusanov ––1 19 6

Interceptions
Passes cut out
Barcelona
- Rodri ––0 12 10
- Pau Cubarsí ––1 11 8
- Xavi Espart ––– 10 8

Man City
- Elliot Anderson ––3 12 10
- Josko Gvardiol ––– 12 8
- Abdukodir Khusanov ––4 9 6
Duels won
Challenges won
Barcelona
- Lamine Yamal ––8 68 11
- Xavi Espart ––– 47 8
- Pau Cubarsí ––4 40 8
Man City
- Elliot Anderson ––10 74 10
- Iliman Ndiaye ––7 55 9
- Josko Gvardiol ––– 53 8
Blocked shots
Shots stopped on the way
Barcelona
- Gerard Martín ––0 3 10
- Pau Cubarsí ––0 3 8
- Rodri ––0 2 10

Man City
- Rúben Dias ––0 5 10
- Matheus Nunes ––1 4 6
- Marc Guéhi ––1 3 9

Key passes
Passes that set up a shot
Barcelona
- Lamine Yamal ––0 35 11
- Pedri ––2 23 11
- Fermín López ––2 20 8
Man City
- Rayan Cherki ––0 20 9
- Iliman Ndiaye ––2 12 9
- Enzo Fernández ––1 12 9

Referee
No referee assigned yet, or no cards data on file for the official appointed to this fixture.
Historic Bets Win Rate
How often each market has actually landed over each side’s last 10 games.
Top 5 Bangers
The five markets that have landed most often over the last 10 games, best first.
-
1
Man City
Over 8.5 Shots on Target in the Match
100.0%
-
2
Man City
Team Over 3.5 Shots on Target
100.0%
-
3
Barcelona
Over 1.5 Goals in the Match
100.0%
-
4
Barcelona
Team Over 12.5 Shots
90.0%
-
5
Barcelona
Team Over 3.5 Corners
90.0%
-
1
LY
 Lamine Yamal
Over 2.5 Shots
100.0%
-
2
EH
 Erling Haaland
Over 0.5 Shots on Target
100.0%
-
3
DL
 Dominik Livakovic
Over 1.5 Saves
90.0%
-
4
AL
 Allan
Over 0.5 Fouls Committed
90.0%
-
5
LY
Lamine Yamal
To Score or Assist
90.0%
Match Result
3 markets
Handicap
3 markets
Goals
9 markets
Both Teams to Score
5 markets
Correct Score
4 markets
Half-Time
6 markets
Half-Time / Full-Time
5 markets
First & Last Goal
5 markets
Clean Sheet & Win to Nil
4 markets
Corners
9 markets
Cards
7 markets
Shots
6 markets
Fouls & Offsides
4 markets
Match Specials
3 markets
Goalscorer
7 markets, best-placed player from each squad
Assists
4 markets, best-placed player from each squad
Shots
6 markets, best-placed player from each squad
Cards
3 markets, best-placed player from each squad
Fouls
3 markets, best-placed player from each squad


Tackles
3 markets, best-placed player from each squad

Goalkeeper
4 markets, best-placed player from each squad

Player Combos
3 markets, best-placed player from each squad